Introduction:
In Power BI, it is often requested by report consumers to have the chart titles update dynamically based on slicer selections. This article will guide you through the process of setting dynamic titles for visuals using DAX (Data Analysis Expressions).
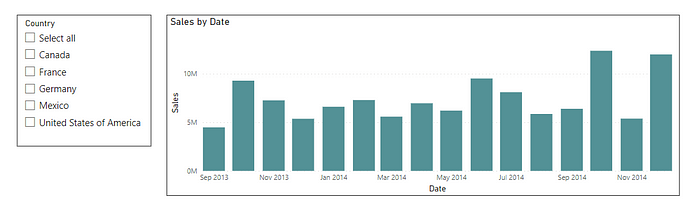
The Data:
For demonstration purposes, let’s consider a column chart displaying sales data by date. We also have a slicer for selecting countries. Our goal is to change the chart’s title to reflect the name of the country selected in the slicer. Currently, the chart’s title is static, set as ‘Sales by Date’.
A. Creating a Dynamic Title for Single Selection:
Step A.1: Create a new calculated measure using the following DAX expression:
Title Single Select = “Sales for country – ” & SELECTEDVALUE(financials[Country], “All Countries”)
This expression retrieves the name of the selected country if only one country is chosen in the filter context. Otherwise, it displays the text “All Countries”.
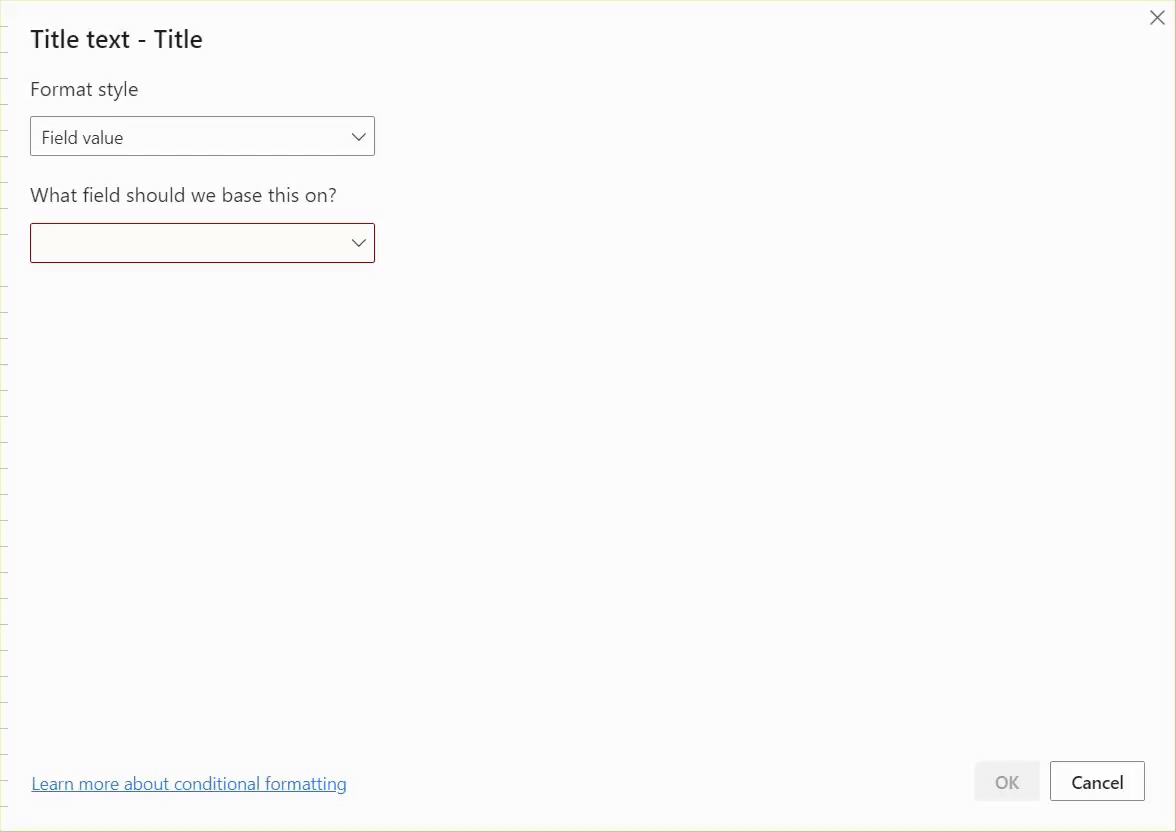
Step A.2: Select the visual, go to Format your visual, navigate to General, expand the Title section, enable it if disabled, and click on Conditional formatting.
Step A.3: Choose the newly created measure (‘Title Single Select’) as the basis for conditional formatting.
Now, when interacting with the chart, you will notice that the title changes according to the selection made in the slicer. This approach works perfectly for single selections.
B. Creating a Dynamic Title for Multiple Selections:
Step B.1: Create a new quick measure following the given steps and rename it as ‘Title Multi Select’.
Step B.2: The DAX code below will be automatically generated:
(*Alternatively, you can create a new measure and copy-paste the provided DAX code)
Title Multi Select =
VAR __DISTINCT_VALUES_COUNT = DISTINCTCOUNT(‘financials'[Country])
VAR __MAX_VALUES_TO_SHOW = 5
RETURN
IF(
__DISTINCT_VALUES_COUNT > __MAX_VALUES_TO_SHOW,
CONCATENATEX(
CONCATENATEX(
TOPN(
__MAX_VALUES_TO_SHOW,
VALUES(‘financials'[Country]),
‘financials'[Country],
ASC
),
‘financials'[Country],
“, “,
‘financials'[Country],
ASC
),
“, etc.”
),
CONCATENATEX(
VALUES(‘financials'[Country]),
‘financials'[Country],
“, “,
‘financials'[Country],
ASC
)
)
Step B.3: Similar to Step A.2 and A.3, replace the measure used in the title with the newly created ‘Title Multi Select’ measure.
Now, as you interact with the chart and select multiple countries in the slicer, you will observe the title changing accordingly. You can customize the title further by adding a prefix or suffix to the DAX code. Feel free to experiment and have fun!
Conclusion:
By leveraging DAX expressions and conditional formatting in Power BI, you can create dynamic titles that update based on slicer selections. Whether it’s a single selection or multiple selections, this technique allows for more interactive and personalized reporting experiences. Explore additional DAX functions and formatting options to further enhance the dynamic titles in your Power BI visuals.